

empty
28.10.2026 05:40 AM
Overview of the EUR/USD Pair. October 28. The Market Still Looks to the Dollar

This image is no longer relevant

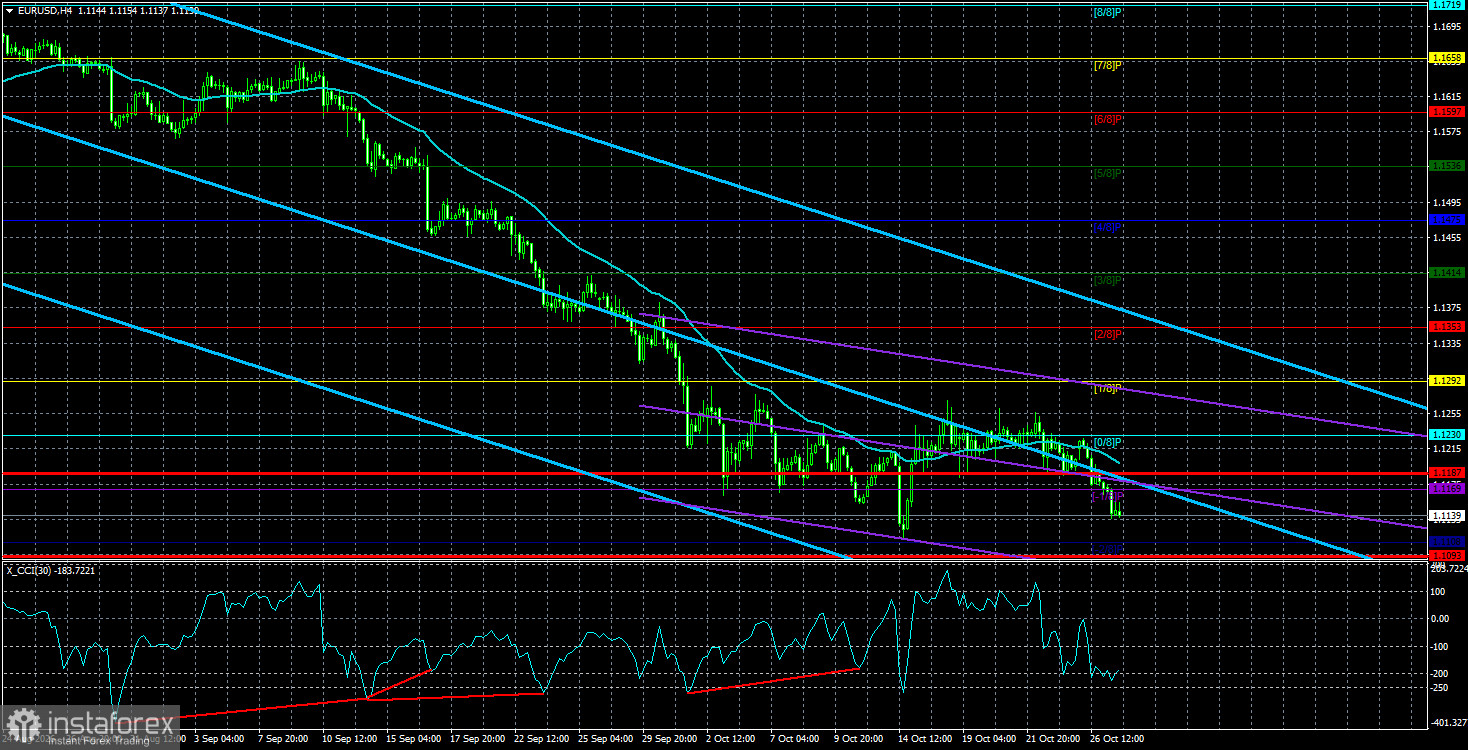
The EUR/USD pair traded lower again on Tuesday and by midday hovered near the previous local low — also the lowest level in roughly 18 months. Ask why the euro fell again, and you'll get the usual explanations. In the past few days the euro lost about 100 pips. That number would be modest if the currency hadn't already surrendered about 600 pips over the past five weeks and then failed to produce even a decent correction. On Monday and Tuesday, there were no solid fundamental reasons for the drops.

Of course, as always, one can point to rising risk-off sentiment, geopolitical tensions, France's budget problems, unrest across EU countries, Federal Reserve tightening, a European Central Bank that is supposedly "not hawkish enough," and so on. As always, someone can invent an explanation. However, on reflection, none of these explanations really fit the facts. This week both the ECB and the Fed will hold meetings. Both central banks intend to keep key rates unchanged, and both plan to raise rates at the final meeting of the year in December. The ECB has already tightened twice in total; the Fed has done so once. And yet the euro is falling like a stone and cannot even produce a minimal correction. We consider the EUR/USD move to be illogical.

Interestingly, the same analysts who daily justify the euro's decline say quite different things about the pound. The Bank of England — which has not yet raised its key rate even once — is portrayed as hawkish, so sterling is said to be holding up better than the euro. Sterling did fall on Tuesday as well, but before that it posted a strong rally of nearly 300 pips. Thus the "problem" seems to be only the euro, and traders are left inventing one fresh rationale after another for each new leg down in the single currency.

We do not consider the ECB and Fed meetings decisive in this situation, especially since the market has already priced in their outcomes. Yes, Lagarde could cast doubt on further tightening — but on what grounds? Warsh could, conversely, stress readiness to keep raising the policy rate—something the market already assumes almost completely without needing his remarks. Thus the euro's problem is not primarily the central banks' policy actions. Even in a hypothetical scenario where the Fed cuts tomorrow, and the ECB hikes 200 bp on Thursday, the euro could still decline, and commentators would then claim the ECB was "not hawkish enough." We believe the pair's fall is driven by inertia, speculation, and technical factors. Technicals remain the dominant influence, and even they now suggest the downtrend is nearing exhaustion.

This image is no longer relevant

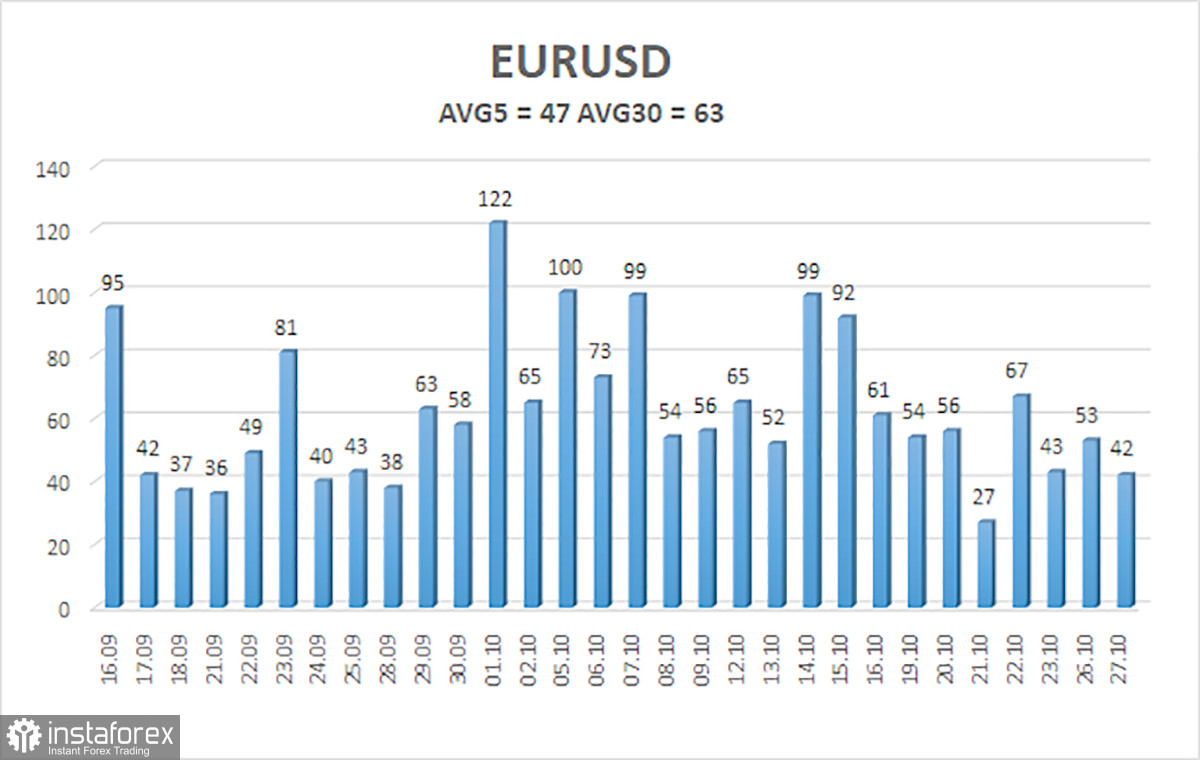
The average volatility of the EUR/USD currency pair over the last 5 trading days as of October 28 is 47 pips, characterized as "average." We expect the pair to move between 1.1093 and 1.1187 on Wednesday. The higher linear-regression channel has turned down, indicating another trend change. The CCI entered the oversold area five times and formed four bullish divergences, warning that the illogical downtrend may be ending. However, the market has so far reacted weakly to technical signals.

Nearest support levels:

S1 – 1.1108

Nearest resistance levels:

R1 – 1.1169

R2 – 1.1230

R3 – 1.1292

Trading recommendations:

The EUR/USD pair continues to move downward, but we still view the decline as a correction before a new uptrend. The global fundamental backdrop for the dollar remains negative, but in 2026, geopolitics, followed by the Fed's hawkish stance, provided strong support for the US currency. When the price is below the moving average, consider short positions with targets at 1.1108 and 1.1093. Above the moving average, long positions are relevant, with targets at 1.1292 and 1.1353.

Explanations for the illustrations:

  • Linear regression channels help determine the current trend. If both are directed the same way, the trend is currently strong.
  • The moving average line (settings 20,0, smoothed) defines the short-term tendency and the direction in which trading should be conducted now.
  • Murray levels are target levels for moves and corrections.
  • Volatility levels (red lines) show the likely price channel the pair will trade in over the next 24 hours, based on current volatility indicators.
  • The CCI indicator — entering the oversold area (below -250) or the overbought area (above +250) — signals an imminent trend reversal in the opposite direction.
Paolo Greco,
InstaForex के विश्लेषणात्मक विशेषज्ञ
© 2007-2026
Earn on cryptocurrency rate changes with InstaForex
Download MetaTrader 4 and open your first trade
  • Grand Choice
    Contest by
    InstaForex
    InstaForex always strives to help you
    fulfill your biggest dreams.
    कॉन्टेस्ट में हिस्सा लें
  • चैन्सी डिपॉजिट
    $ 3,000 के साथ अपना खाता जमा करें और प्राप्त करें $1000 अधिक!
    में अक्टूबर हम आकर्षित करते हैं $1000 चैंसी डिपॉज़िट में
    ट्रेडिंग अकाउंट में $ 3,000 जमा करके जीतने का अवसर प्राप्त करें इस शर्त को पूरा करके आप प्रतियोगिता में भाग ले सकते हैं
    कॉन्टेस्ट में हिस्सा लें
  • ट्रेड वाइज़, विन डिवाइस
    कम से कम $500 के साथ अपने खाते में टॉप अप करें, कॉन्टेस्ट के लिए साइन अप करें और मोबाइल डिवाइस जीतने का मौका पाएं।
    कॉन्टेस्ट में हिस्सा लें
  • 30% बोनस
    हर बार खाता टॉप अप करने पर 30% बोनस प्राप्त करें
    बोनस पायें

अनुशंसित लेख

अभी बात नहीं कर सकते?
अपना प्रश्न पूछें बातचीत.
Widget callback