The GBP/USD pair also traded lower on Wednesday, but the situation for sterling is completely different. The technical picture for the pound differs fundamentally from that for the euro, and we believe technicals are currently sterling's main friend.
We have repeatedly pointed out the two sideways channels on the daily and weekly timeframes. Two weeks ago, price fell to the lower boundaries of both channels, bounced off them and removed liquidity at prior lows, creating deviations. From that point, traders could reasonably expect a rise toward at least the upper boundary of the daily sideways channel. That boundary lies near 1.3650. Over the last two months, the move also fits the technical picture well. The pound has simply fallen from the top of the daily flat to its bottom. Sterling is not collapsing like a stone—the flat explains why the market seems to work off many fundamental and macro events in a seemingly illogical way. Within a flat, moves are often incoherent because the market is accumulating or redistributing positions.
From this we can draw several conclusions. First, regardless of the fundamental or macro backdrop, sterling could keep rising. Second, until price leaves the daily flat, we can't talk about a long-term downtrend. Third, what the dollar showed in 2026 is not even a meaningful rally against the pound but ordinary pullbacks inside the visible sideways channel on higher timeframes.
The dollar remains weak because of Donald Trump's policies, which, in our view, are harming the U.S. on many fronts. America's standing — including its reputation as the world's primary military power — was damaged after the "two-week war" with Iran. Trade wars and overtly aggressive actions toward many countries have dented U.S. global leadership. If the world once sought to befriend, trade with, and develop alongside America, countries such as Canada now look more eagerly to the EU and China than to the U.S.—with whom they had long friendly ties. Even Republicans criticize half of the U.S. president's decisions, and some are subject to the Supreme Court. The U.S. has become, in effect, a place of dictatorship where one person dominates, and Congress's opinion matters little. It makes one wonder why Trump hasn't simply dissolved Congress by decree if it allegedly doesn't influence his decisions.
2026 has been a corrective year, although at the start of the year we expected further GBP/USD gains. Were it not for Trump's conflict with Iran — which could continue into 2027 — the pound would likely already be well above 1.4000. That target now seems pushed into 2027. The dollar may gain support from Federal Reserve tightening, but we expect the Fed to move toward easing next year. When that happens, the dollar will face a much tougher environment.
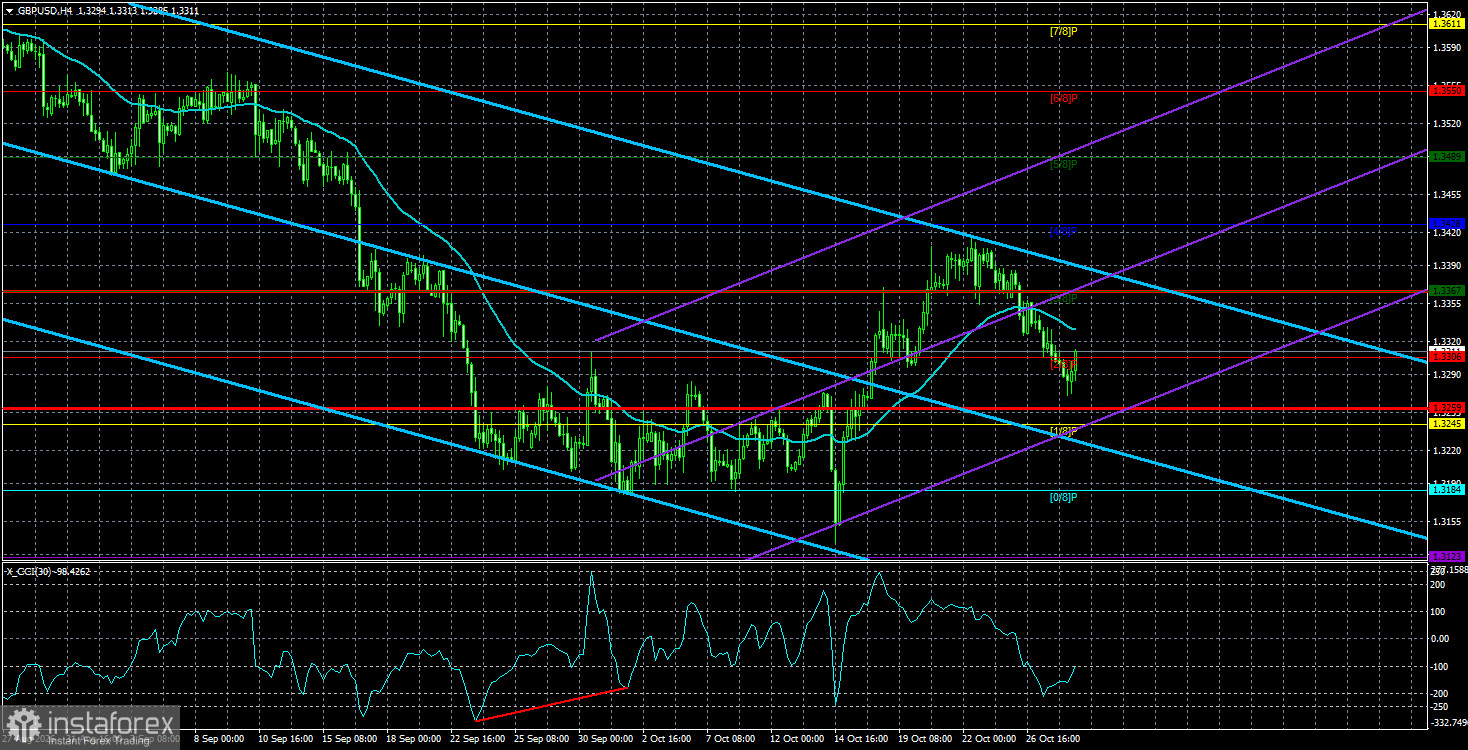
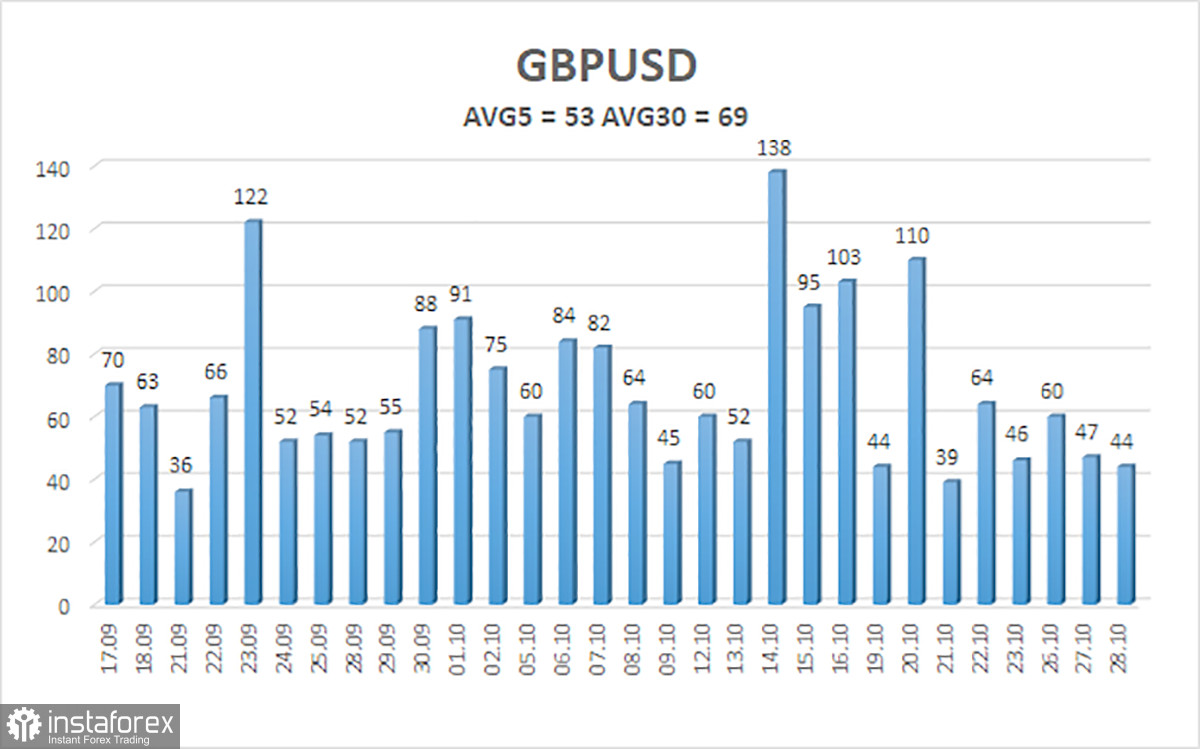
The average volatility of the GBP/USD pair over the last 5 trading days is 53 pips. For the pound/dollar pair, this value is considered "low." Therefore, on Thursday, October 29, we expect movement within a range bounded by 1.3259 and 1.3365. The higher linear-regression channel is turning down again. The CCI entered the oversold area twice and formed a bullish divergence, warning of the downtrend's exhaustion.
Nearest support levels:
S1 – 1.3306
S2 – 1.3245
S3 – 1.3187
Nearest resistance levels:
R1 – 1.3367
R2 – 1.3428
R3 – 1.3489
Trading recommendations:
The GBP/USD pair has begun an uptrend that could become the start of a long-term move. Donald Trump's policies will continue to pressure the U.S. economy, so we do not expect long-term dollar strength. So far in 2026, geopolitics and inflation have been positive for the dollar, pushing capital into safe havens and prompting the Fed to resume tightening. However, on the weekly timeframe, price remains flat between 1.3150 and 1.3780 within a four-year uptrend, supporting expectations for sterling's medium-term rise. Long positions with targets of 1.3428 and 1.3489 can be considered while price is above the moving average. When price is below the moving average, you can trade the downside with targets of 1.3259 and 1.3245.
Explanations for the illustrations:
- Linear regression channels help determine the current trend. If both are directed the same way, the trend is currently strong.
- The moving average line (settings 20,0, smoothed) defines the short-term tendency and the direction in which trading should be conducted now.
- Murray levels are target levels for moves and corrections.
- Volatility levels (red lines) show the likely price channel the pair will trade in over the next 24 hours, based on current volatility indicators.
- The CCI indicator — entering the oversold area (below -250) or the overbought area (above +250) — signals an imminent trend reversal in the opposite direction.